Making sense of the Belgian federal budget, part 1
In this series of posts, I briefly explain how I made a visual overview of the yearly budget of the Belgian federal government. You can find a beta version at www.federalebegroting.be.
In a recent discussion about public transportation in Belgium (my home country), the issue of federal subsidies came up. The Belgian railway system is run by private companies, but they don’t manage to turn a profit. In order to keep these companies afloat, the government subsidizes them to the tune of a couple billion euros per year. In an effort to put this number into perspective, I tried to find a good visualization of the yearly budget of the Belgian federal government. I couldn’t find any, so I decided to build one for myself.
Note: some of the names appearing in this visualization are in Dutch. The budget data is not available in English. It may be useful to know that begroting means budget (more or less).
Step 1: getting the data
The website www.begroting.be offers downloads of the Belgian federal budget. Ever year, two version of the budget are made:
- the initial version,
- the revised version.
Also, the budget is split into two independent documents:
- the income, for example from taxes,
- the expenses.
We will be visualizing the revised version of the expenses for 2017. Although the initial numbers for 2018 are now available on the website, they were not when I started this project. Once the visualization is up and running, we can easily create a visualization of the latest numbers.
The data comes in two types of files:
- PDF documents, containing the legal text outlining the budget, as well as detailed tables,
- Excel spreadsheets, containing all of the data in a single sheet.
Extracting the tables from the PDF document is hard, so we will take our data from the spreadsheet. Unfortunately, the descriptions of items in the spreadsheet are often heavily abbreviated, incomplete, or missing completely. We’ll get back to fixing this later.
Step 2: fixing the numbers
The official legal text is contained in the PDF documents. To cross-check the numbers with the spreadsheets, we compare the totals from the PDF and the Excel file. As it turns out, they don’t match up. Pivot tables allow us to quickly find where the discrepancies are. Only a handful of items of the spreadsheet don’t agree with the official texts (they are spread over two departments). In all of them, the spreadsheet turns out to still have the numbers from the initial budget of 2017, rather than the revised one. We correct these numbers to agree with the official revised version.
Step 3: picking a visualization technique
The budget is structured as a tree of depth 5.
- The entire budget is spread over 21 departments.
- Each department’s budget is spread over several sections.
- Each section’s budget is spread over several programs.
- Each program’s budget is spread over several activities.
- Finally, each activity’s budget is spread over several allocations.
The Dutch names for these levels are departement, organisatie-afdeling, programma, activiteit, basisallocatie. The terms above are loose translations of (shortened versions of) these words.
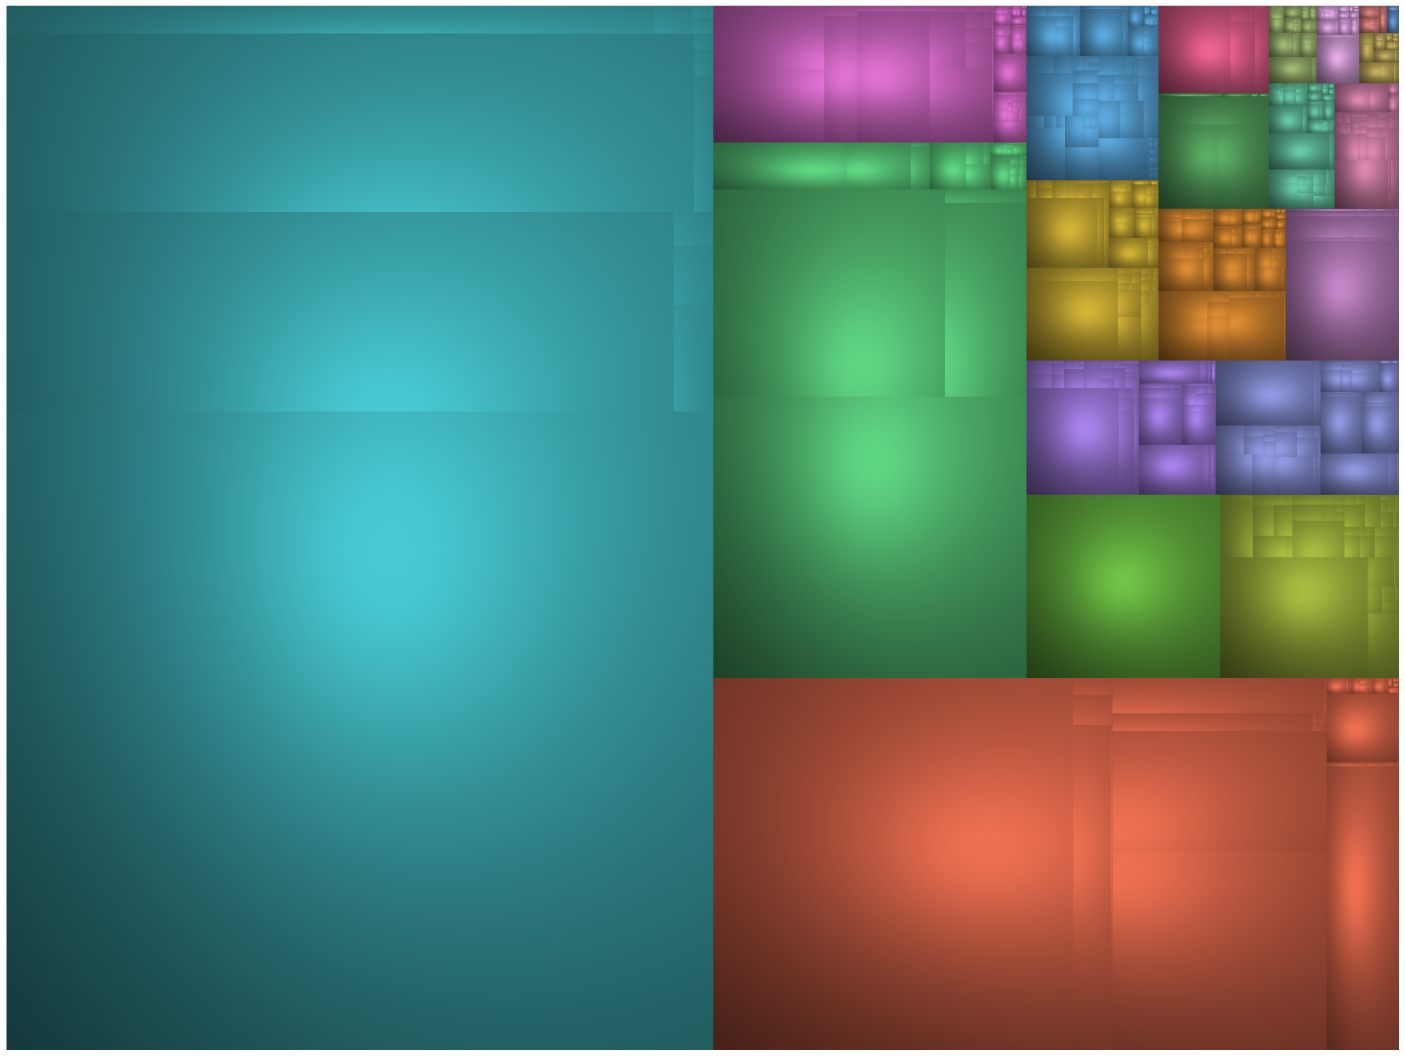
A good visualization of a hierarchical structure like this, where it is vital to show the size of subtrees, is offered by a treemap. In particular, cushion treemaps use a clever shading algorithm to give a clear picture of the structure of a large tree. They are often used by software that shows disk usage on a computer, to give an at-a-glance overview of which files are taking up all your gigabytes.
Step 4: choosing web technologies
I want the visualization to be accessible online, so JavaScript is the obvious choice for the implementation. I’ve been wanting to play around with D3.js for a while, but it’s not a good choice for this particular project, for two reasons:
- performance: a quick google search shows that the number of rectangles we will need can bring web browsers to a crawl when created as separate elements in the DOM,
- freedom in our shading algorithm: shading the rectangles with nice gradients would be non-trivial.

A better choice is WebGL, with custom shaders for the, well, shading.
Step 5: implementation and first results
We use the following articles as references for the implementation:
- Squarified Treemaps by Bruls, Huizing and van Wijk,
- Cushion Treemaps: Visualization of Hierarchical Information by van Wijk and van de Wetering.
The first reference presents an algorithm for recursive subdivision of rectangles to create treemaps with somewhat-close-to-square rectangles. The visualization of the budget actually uses a slightly modified version of this algorithm. It is written in pure JavaScript.
The second reference shows how to turn the rectangles into shaded cushions, for a better impression of the hierarchy in the data. We implement this algorithm without modifications using a combination of JavaScript (for the computation of the correct polynomials) and GLSL (for the actual shading on the GPU).
After adding a splash of color, the initial result for the visualization looks like the picture below. Nice!
Up next
There are still a lot of things that can be done to make this visualization more useful. Here are two important ones:
- allow the user to select subtrees, and otherwise navigate through the budget,
- provide descriptions of each subtree.
Next time, we’ll talk about these.